Note: Exhibit 1 originally published February 13, 2024 incorrectly identified the $0.22 “EPC Margin” as a “developer fee”. We apologize for the incorrect identification.
In Sophic Capital’s Sunny Side Up report, we looked at how Sophic Capital client UGE (the “Company”) [TSXV:UGE; OTCQB:UGEIF], a full lifecycle developer and operator of U.S. community solar projects, finances its community solar projects as well as its development pipeline. Specifically, UGE’s projects create more value with decreasing risk as they proceed through the Company’s development pipeline. And to finance the Company’s growth, management has successfully closed several Green Bond financings backed by UGE’s large pipeline of projects, financed projects with project-level debt, and leveraged investment tax credits and tax equity structures.
In this report, we’ll look at a general example of the cash flows that a UGE project can generate.
Project Cash Flows
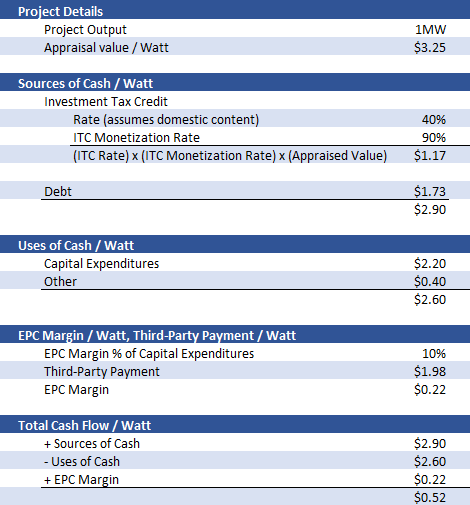
UGE’s project development model is unique in that it does not require cash to fund equity ownership of its projects. Exhibit 1 is a simplified example that demonstrates cash inflows and outflows for projects. Exhibit 1 is not meant for investors to apply to each UGE project for valuation purposes; instead, investors should use Exhibit 1 to understand the basics of how the Company generates and consumes project cash.
Exhibit 1: Example of Project Cashflows for a 1 MW UGE Community Solar Project
(Numbers are Estimates and Not Project-Specific)

Source: Sophic Capital
Sources of Cash
The sources of cash come from investment tax credits and debt. ITCs can range from 30% to 50% (or higher) of a project’s value, when factoring in the domestic content adder if key components are manufactured in the United States, or the 10% adder when projects are located in low-income communities, on indigenous lands, on landfills, or are in communities located near fossil fuel extraction or processing sites. To claim ITCs, an independent third-party must appraise the project to estimate its lifetime value. The product of the appraised value, the applicable ITC rate, and the rate at which the developer can monetize the ITC results in one of the main sources of cash flow for funding the project. The other is non-recourse project debt, which is a product of lifetime cash flows of the project and a ‘debt service coverage ratio’ agreed to between the developer and its lender.
Developers typically monetize the ITC at rates between 80% and 110%, because:
- The reason that this can be higher than 100% is because of accelerated depreciation, which has the effect of providing additional Year 1 tax benefits that can sometimes be monetized by the tax equity investor;
- Other times, depreciation is taken over a longer time period, or can’t be fully monetized for other reasons, and in that case, you would expect to see ITC monetization below 100% to provide the return to the tax equity investor
The debt is sized by the cash flows the project will generate. Debt size is mostly independent of valuation, capital expenditures, and tax credits. The debt is construction-to-term, becoming non-recourse to the owner of the project once the project reaches commercial operation. This means debt is available when a project is granted Notice to Proceed (NTP), funds construction, and flips to term (often 7-years amortizing over, say, 20 years) once the project commences operations. Oftentimes, construction debt will also bridge towards the tax equity investment, which comes in closer to commercial operation than NTP.
Uses of Cash
The uses of cash are primarily the capital expenditures to build the project, as well as other uses, such as interconnection, professional fees, and payment to third-party subscription management companies for community solar projects.
EPC Margin / Third Party
UGE generates part of its Developer Surplus from building projects. Typically, construction debt is sized in consideration of the project’s capital expenditures. This is the bill that UGE’s engineering, procurement, and construction (EPC) segment gives to the project to complete the build. A typical EPC margin is approximately 10% of capital expenditures. This means that third parties building the projects receive 90% of capital expenditures. This 90% of capital expenditures is the use of cash, whereas the 10% EPC Margin is a source of cash for UGE.
Project Cash Flows
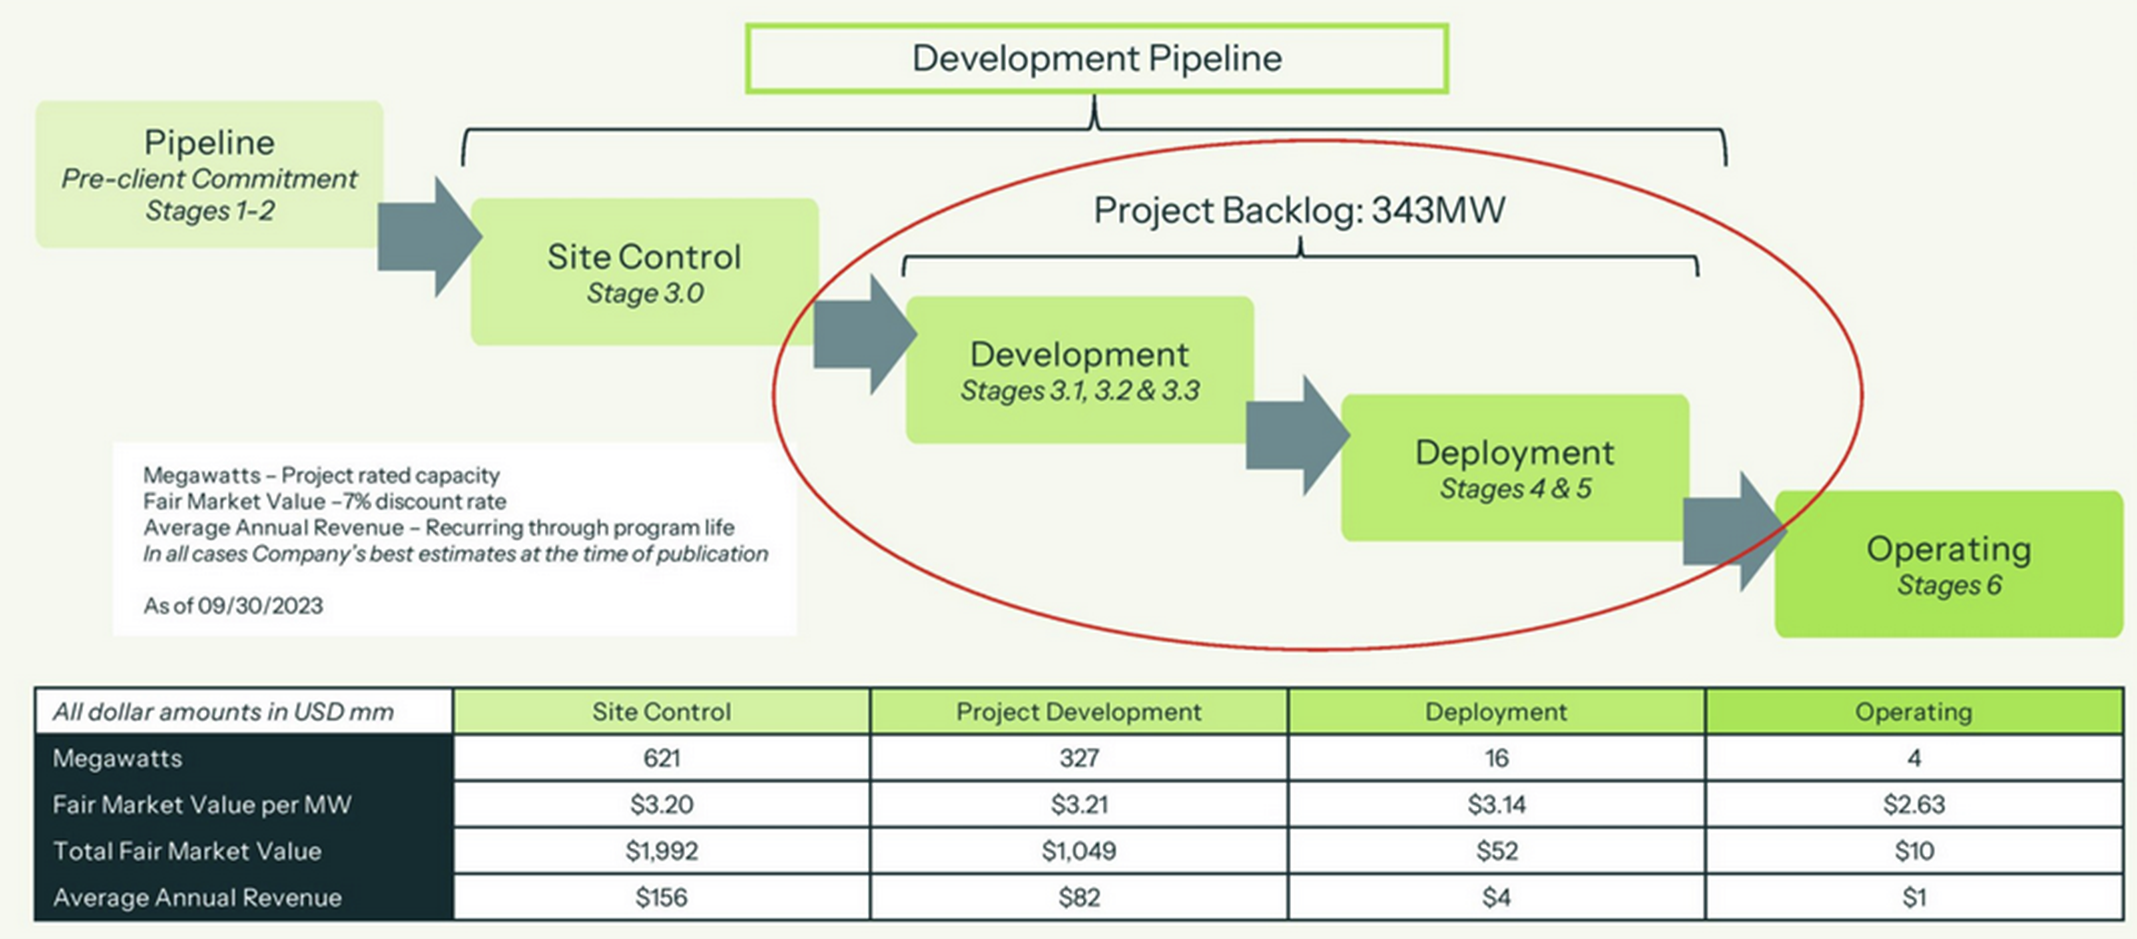
UGE has a 343MW project backlog and 5.3MW of operating assets. The Company has an additional 621MW of projects under site control. The backlog alone is expected to generate $156 million of annual recurring revenue once operating with an average fair market value of a $3.20/W (Exhibit 2).
Exhibit 2: UGE is focused on consistently delivering projects to commercial operation
Coming up…
In our next report, we’ll dive deeper into the pipeline, the potential value of this asset and where UGE is trading compared to its pipeline.


